
Your Health Score Is a Horoscope
And it’s costing you accounts while you debate the weights.

I’ve been in technical Customer Success for over 13 years (AWS, GitHub, Chef, now Drata) and I’ve watched the same thing happen at every company once it hits a certain size. Someone decides the CS org needs a health score. An initiative gets spun up. People argue about weights on a recurring “health score design meeting” for three weeks. A dashboard goes live. Leadership feels better. And absolutely nothing changes about how your team actually helps customers.
Health scores are the horoscope of Customer Success. Vague enough to feel true. Updated too slowly to be useful. And they exist mostly to make the person reading them feel like they understand something they don’t.
This is the first post in a series where I’m going to challenge things the CS industry treats as settled, offer a framework I’d actually use, and hand you the prompt library or agent workflow to put it into practice. No theory without tooling. Here we go.
The Problem: Performative Dashboards
You know how these things get built. Take a handful of inputs (NPS, support ticket volume, login frequency, maybe a CSM gut-feel rating), throw some weights on them that somebody argued about in a meeting, and produce a composite number. Green, yellow, red. Board deck looks great.
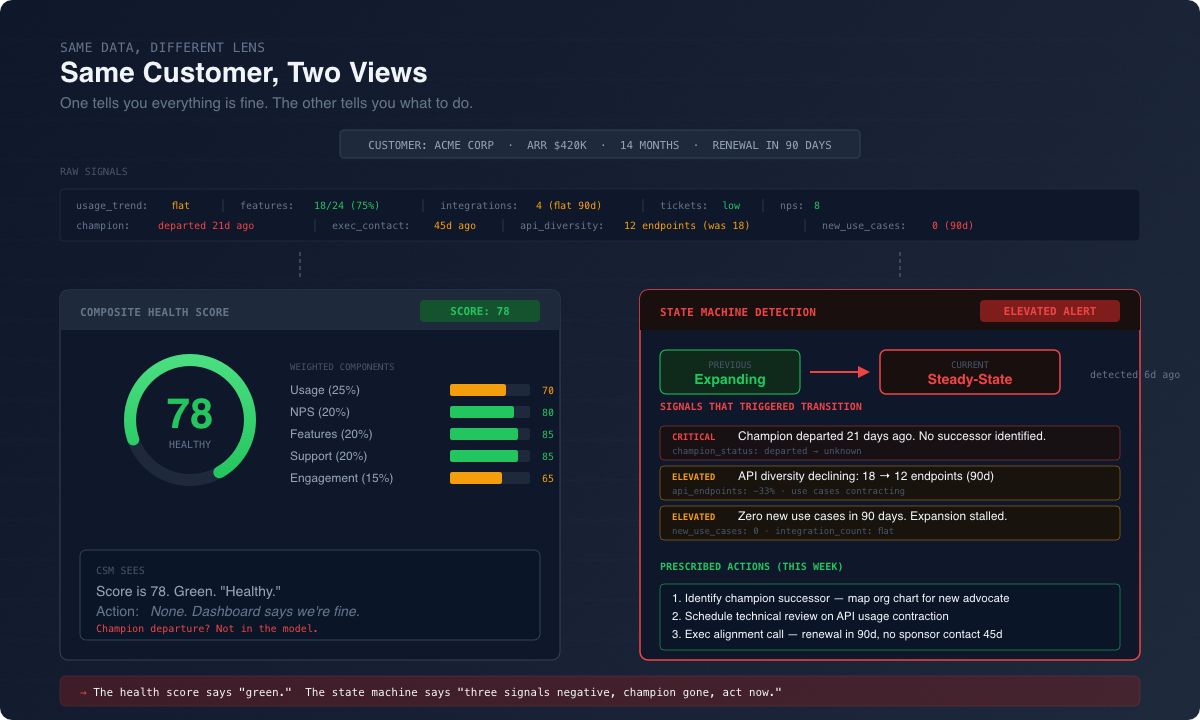
Now ask a CSM what they’re supposed to do when an account turns yellow. You’ll get a shrug. Or worse, they’ll send a check-in email. The score told them something changed but not what, not why, and definitely not what to do about it. It’s a summary of stuff that already happened pretending to be a prediction.
But here’s the part that really gets me. The deeper failure isn’t that the score is wrong. It’s that the score trains your team to manage numbers instead of managing customers. CSMs figure out how to game the inputs. Leadership starts trusting the dashboard more than the people closest to the accounts. And the signals that actually predict churn (deployment logs, API call patterns, the day a champion updates their LinkedIn) those never make it into the model. Too hard to quantify. Too messy to weight.
I’ve watched a team spend months arguing about whether NPS should be 15% or 20% of the composite score. While that was happening, a strategic account quietly ripped out the integration because their internal champion left and nobody noticed. Health score was green the whole time.
The Framework: Signal-Based Customer State Detection
The answer isn’t a better health score. It’s scrapping the whole concept.
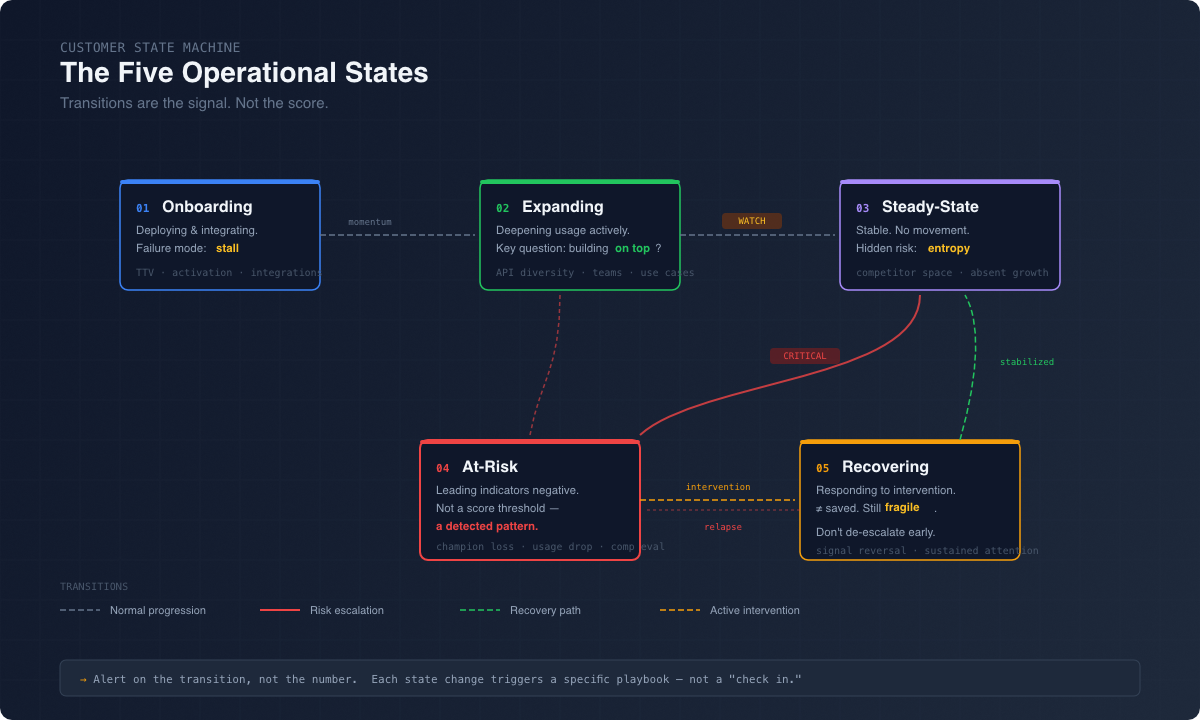
Replace it with a state machine. Customers aren’t a number on a 0-100 scale. They’re in one of a handful of states at any given time:
Onboarding: Still implementing, clock is ticking on time-to-value
Expanding: Rolling out to new teams, adding integrations, usage climbing
Steady-State: Stable, not growing, not shrinking. Coasting.
At-Risk: Usage declining, integrations getting pulled, champion gone quiet
Recovering: You’ve intervened, re-engagement is underway
The thing that matters isn’t the state itself. It’s the transitions. When a customer moves from Expanding to Steady-State, that means something. When they slide from Steady-State to At-Risk, that’s not a yellow dashboard. That’s a fire drill with a specific playbook attached to it.
Three ideas make this actually work in practice:
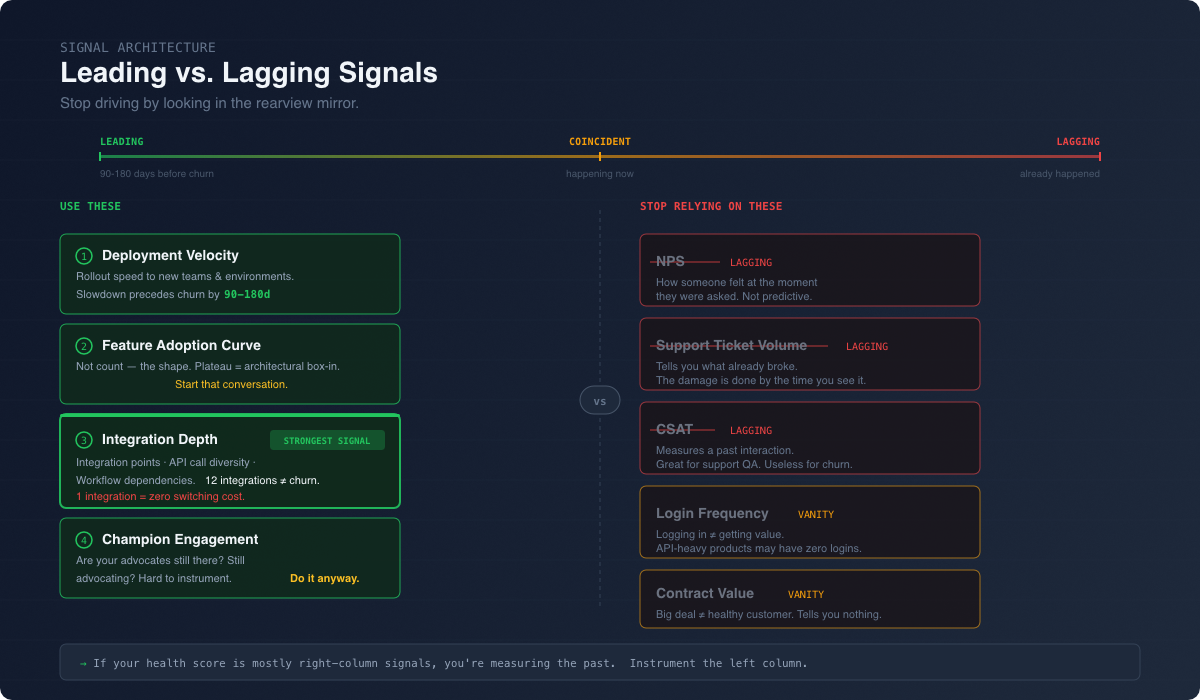
1. Flip from lagging to leading indicators.
Most health scores are built on data that tells you what already happened. NPS is how someone felt last quarter. Ticket volume is what already broke. You need the stuff that tells you where the account is headed: deployment velocity, feature adoption curves, how deep the integration goes, how often the champion is engaging. Forward-looking, not rearview mirror.
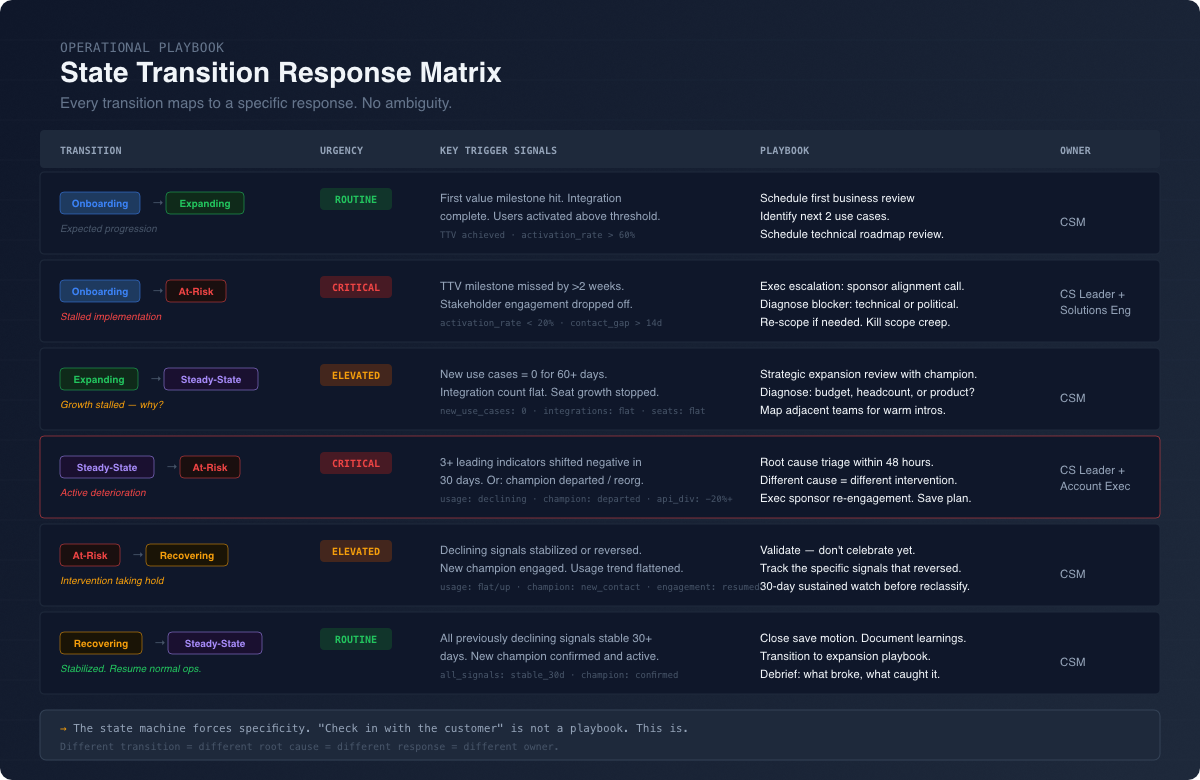
2. Trigger playbooks off state transitions, not score changes.
“Score dropped from 82 to 71” is meaningless. Nobody knows what to do with that. But “this account just moved from Expanding to Steady-State”? Now you’ve got something. Schedule an architecture review. Find the next expansion use case. Get back in front of the exec sponsor. That’s a to-do list, not a guessing game.
3. Treat technical depth as your best retention signal.
This one’s specific to technical products, and it’s the hill I’ll die on. The best predictor of whether a customer stays isn’t their satisfaction score. It’s how tangled up your product is in their architecture. Count the integration points. I like to call them “retention anchors”. Look at API call diversity. Figure out how many of their internal tools depend on yours. A customer running 15 integrations with 4 internal tools built on your API? They’re not leaving. I don’t care what their NPS is. A customer with one shallow integration and a great NPS? They’re one executive decision away from rip-and-replace.
The Prompt Library
OK, so how do you actually start doing this? Here are three prompts you can run this week against real customer data. They work with Claude, ChatGPT, whatever you’ve got. Pull structured data from your CRM, product analytics, and support system, and feed it in.
Prompt 1: Customer State Classifier
This one replaces your health score for a single account.
You are a Customer Success analyst specializing in technical B2B SaaS.
Given the following customer data, classify this customer into one of
these operational states: [Onboarding, Expanding, Steady-State,
At-Risk, Recovering].

Customer data:
- Account age: {months}
- Product usage trend (last 90 days): {increasing/flat/declining}
- Features activated vs. available: {ratio}
- Support ticket trend: {increasing/flat/declining}
- Last executive sponsor contact: {days ago}
- Recent integration/API changes: {description}
- Contract renewal date: {date}

Classify the state and explain which signals were most determinative.
Then recommend the top 3 actions the CSM should take this week,
specific to the detected state.
Try this: Run it on your top 20 accounts and compare to what your current health score says. I’d bet money at least 3 accounts come back in a different state than your dashboard shows.
Prompt 2: State Transition Detector (Weekly Batch)
This is your new Monday morning portfolio review.
You are reviewing a portfolio of {N} accounts. For each account below,
compare their current signals to their signals from 30 days ago.
Identify any accounts that have shifted operational states.

For each state transition detected:
1. Name the transition (e.g., "Expanding → Steady-State")
2. Identify the 2-3 signals that drove the change
3. Flag urgency: routine, elevated, or critical
4. Recommend the specific playbook to execute

Account data:
{structured account data with current and 30-day-prior snapshots}
Try this: Use it to replace your weekly health score review. Instead of everyone staring at a dashboard trying to figure out what the numbers mean, you walk in with a ranked list of state transitions and a playbook for each one. The meeting goes from interpretation to execution.
Prompt 3: Health Score Audit
Run this once to find out where your current model is lying to you.
I'm going to share our current health score model. Analyze it for
the following failure modes:
- Lagging indicator dependency (signals that tell you what already
  happened)
- Vanity signal inclusion (metrics that feel important but don't
  predict outcomes)
- Missing technical depth signals
- Weighting that obscures rather than clarifies

Current health score model:
{paste your model: inputs, weights, thresholds, and any logic}

Provide a redesigned scoring approach using state-based detection
instead of composite scoring. Map each of our current inputs to
either: a state classification signal, a transition trigger, or
"remove: does not predict outcomes."
Try this: Paste your actual health score model in. Inputs, weights, thresholds, all of it. You’ll find out which signals actually predict outcomes, which ones are vanity metrics making you feel good, and how to restructure around state detection. Do it before your next QBR.
The Bottom Line
Health scores were built for a world where CS was an account management function and the main event was a quarterly business review. If you’re running CS for a technical product, where your customers are engineers, your value lives in their architecture, and retention comes down to integration depth, you need something that thinks in states and transitions, not weighted averages.
Kill the horoscope. Build a state machine.
This is the first post in a series on rebuilding Customer Success for technical products. Next up: why your QBR format is optimized for the wrong audience. Subscribe at michaelpgoetz.substack.com if you’re building CS for people who build software.